animate directive#
The animate directive creates animated plots by varying one or more variables across frames. It extends the plot directive and produces a WebP or GIF file embedded directly in the page.
Basic usage#
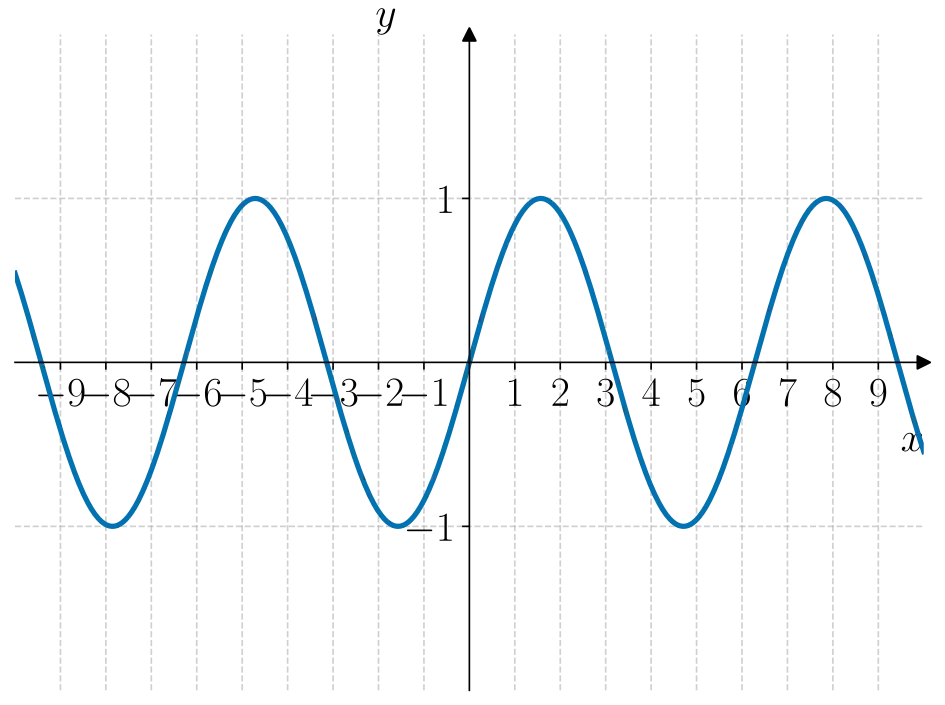
To animate a sine wave with varying frequency:
:::{animate}
animate-var: a, 1, 5, 20
fps: 10
function: sin(a*x)
xmin: -10
xmax: 10
ymin: -2
ymax: 2
width: 80%
:::
which yields:
Syntax overview#
:::{animate}
animate-var: name, start, end, frames
fps: 10
key: value

Optional caption text.
:::
The animate-var line defines the variable that changes across frames. All plot keys (functions, points, lines, polygons, etc.) are available and can reference the animation variable by name.
Options#
Option |
Meaning |
|---|---|
|
Variable spec: |
|
Frames per second (default |
|
Total duration in seconds (alternative to |
|
Whether to loop ( |
|
Output format: |
|
CSS width |
|
|
|
Force regeneration |
All plot directive options are also supported (function, point, xmin, xmax, grid, etc.).
Examples#
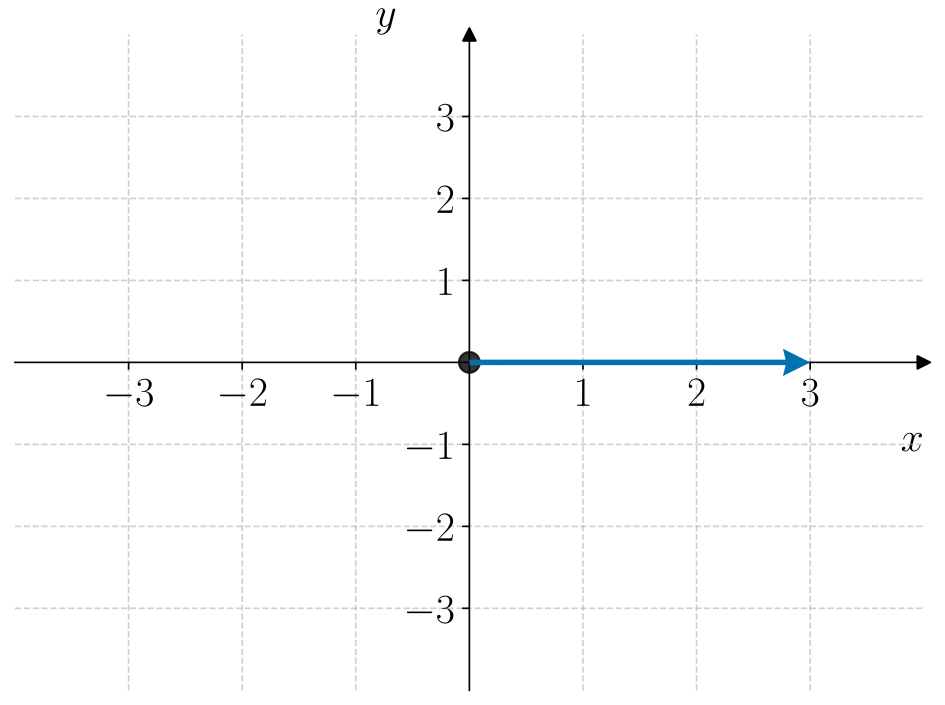
Rotating vector#
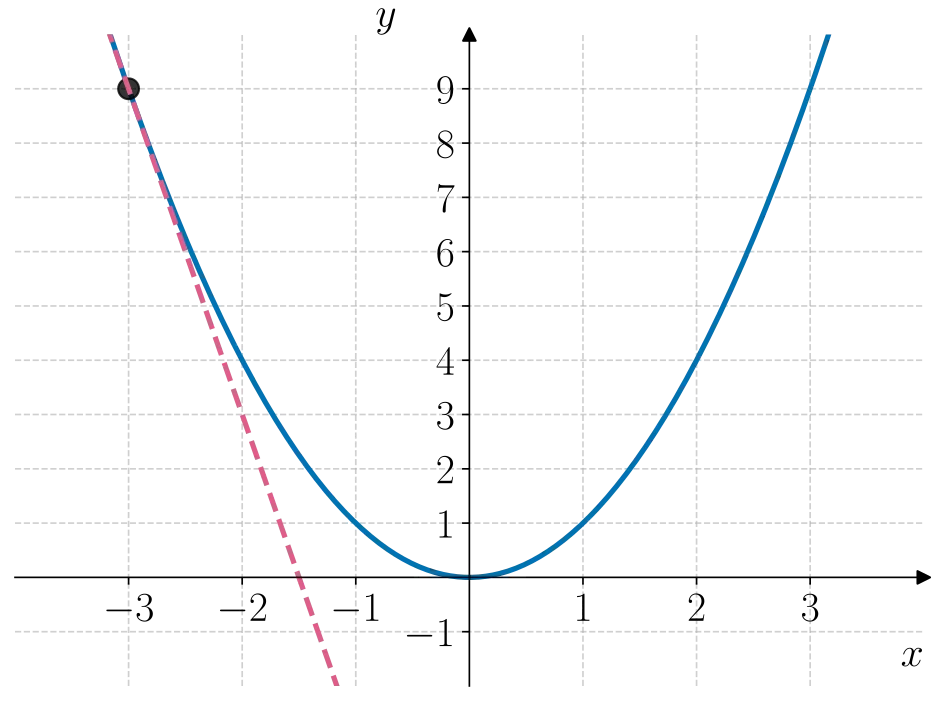
Moving point on a parabola#
Expanding circle#

Tips#
The directive inherits all drawing primitives from
plot, so functions, points, tangents, polygons, curves, and macros all work.Use
nocache:during development to force regeneration.WebP is the default format and is smaller than GIF.
Caption text goes after the first blank line in the content.
Source#
The implementation lives in src/munchboka_edutools/directives/animate.py.