Interactive 3D figures with Three.js#
backend: threejs is the default for interactive-plot3d and gives live 3D
math graphs. Sliders are optional; all figures support rotation and zoom. The
legacy frames backend is still available via an explicit backend: frames
for existing figures (see the interactive-plot3d
directive). The earlier jsxgraph backend name is a
deprecated alias for threejs and emits a build warning.
Live example gallery#
Each figure below is followed by the complete Markdown used to create it. Drag a figure to rotate it, and use its sliders or view buttons to explore.
1. Vectors, points, and custom ticks#
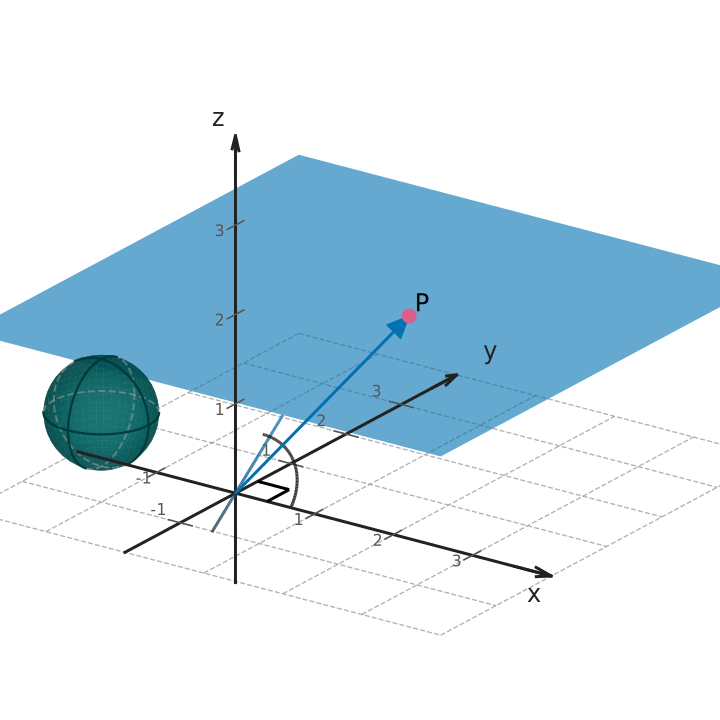
Move a to change the vector and point. This example combines a coordinate grid, custom tick spacing, a line, a plane, a sphere, and angle markers.
Static preview. Enable JavaScript for an interactive view.
Markdown source
:::{interactive-plot3d}
backend: threejs
width: 100%
height: 460px
interactive-var: a, 0, 3, 61
interactive-var-start: 1.5
xrange: (-2, 4)
yrange: (-2, 4)
zrange: (-1, 4)
elev: 22
azim: -55
grid: true
ticks: true
xstep: 1
ystep: 1
zstep: 1
plane: equation=z = 0, color=orange, alpha=0.25
sphere: center=(-1, -1, 1), radius=0.6, color=teal
vector: (0, 0, 0), (a, 1, 2), blue
point: (a, 1, 2), red
line: point=(0, 0, 0), direction=(1, -1, 1), style=dashed
right-angle: at=(0, 0, 0), dir1=(1, 0, 0), dir2=(0, 1, 0), size=0.4
angle: dir1=(1, 0, 0), dir2=(0, 1, 1), radius=0.7
text: at=(a, 1, 2), value="$P$", offset=(0.1, 0.1, 0.1)

Roter koordinatsystemet og flytt punktet med skyveknappen.
:::
2. A perpendicular from a point to a plane#
Move h to change the height of the point. The foot and right-angle marker are constructed automatically; the plane stays fixed.
Static preview. Enable JavaScript for an interactive view.
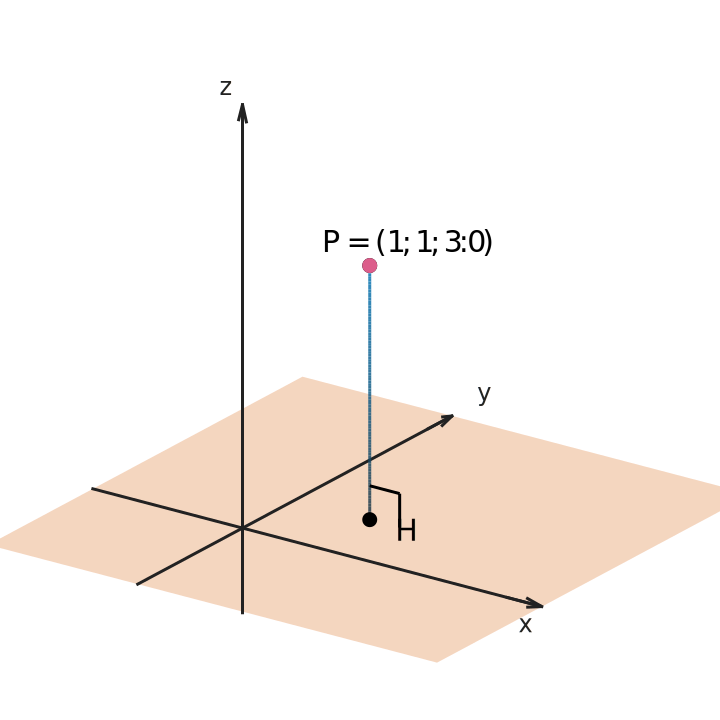
Fig. 1 The segment PH is perpendicular to the plane z=0.#
Markdown source
:::{interactive-plot3d}
backend: threejs
width: 100%
height: 440px
interactive-var: h, 1, 4, 31
interactive-var-start: 3
xrange: (-2, 4)
yrange: (-2, 4)
zrange: (-1, 5)
ticks: off
plane: equation=z=0, color=orange, alpha=0.25
point: (1,1,h), red
normal-segment: point=(1,1,h), plane=z=0, color=blue, right-angle-size=0.4
text: at=(1,1,h), offset=(0.3,0.3,0.2), value="$P=(1,1,{h:.1f})$", fontsize=15
text: at=(1,1,0), offset=(0.3,0.3,-0.2), value="$H$", fontsize=15

The segment PH is perpendicular to the plane z=0.
:::
3. An angle that changes with a vector#
Move a to change the angle in the xy-plane. The square marker is deliberately shown only when the two directions are perpendicular (a=0).
Static preview. Enable JavaScript for an interactive view.
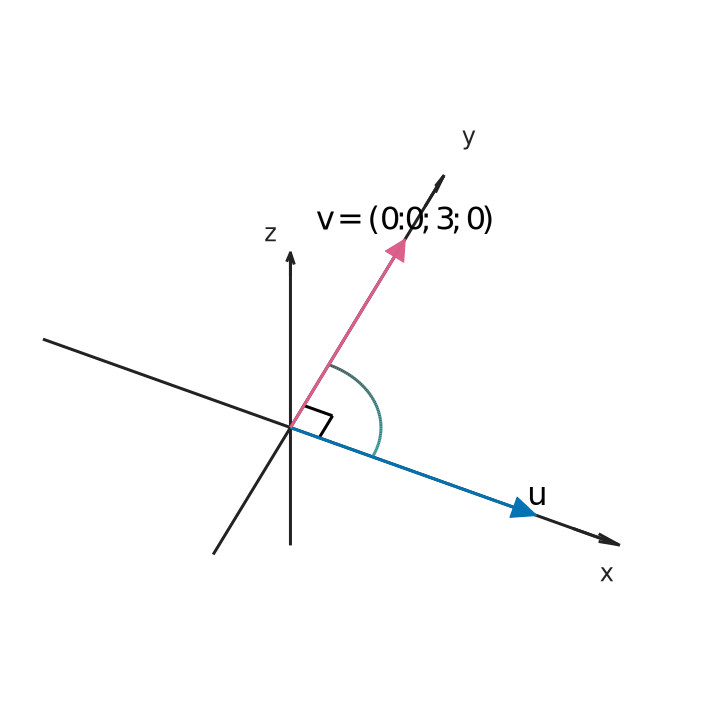
Fig. 2 The arc follows the angle between u and v.#
Markdown source
:::{interactive-plot3d}
backend: threejs
width: 100%
height: 440px
interactive-var: a, -2, 2, 41
interactive-var-start: 0
xrange: (-3, 4)
yrange: (-2, 4)
zrange: (-2, 3)
ticks: off
elev: 50
azim: -65
vector: (0,0,0), (3,0,0), blue
vector: (0,0,0), (a,3,0), red
angle: at=(0,0,0), dir1=(1,0,0), dir2=(a,3,0), radius=1, color=teal
right-angle: at=(0,0,0), dir1=(1,0,0), dir2=(a,3,0), size=0.35
text: at=(3,0,0), offset=(0,0,0.3), value="$u$", fontsize=16
text: at=(a,3,0), offset=(0,0,0.3), value="$v=({a:.1f},3,0)$", fontsize=16

The arc follows the angle between u and v.
:::
4. A prism and a pyramid with shared height#
Move h to change both solids. Axes and ticks are hidden to focus on the shapes. Dashed hidden edges are visible through the opaque prism.
Static preview. Enable JavaScript for an interactive view.
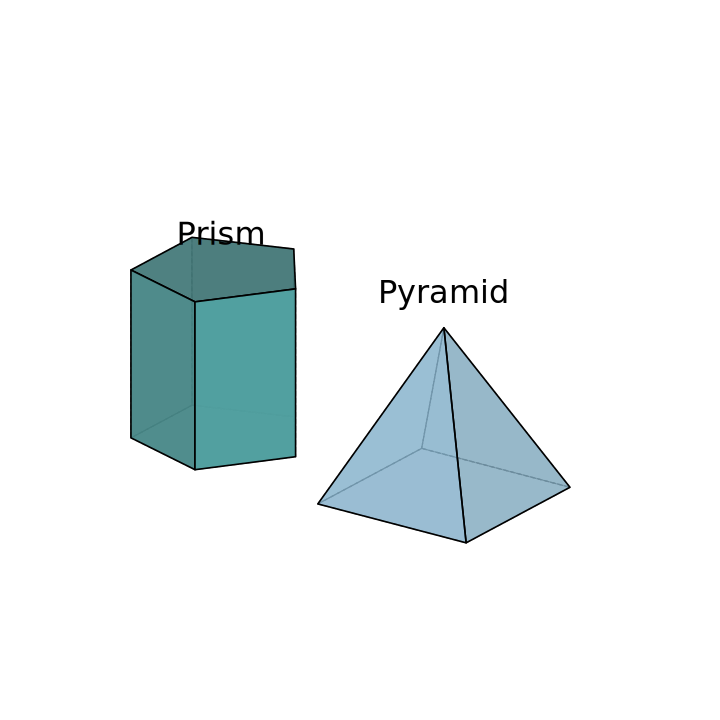
Fig. 3 Two solids controlled by the same height parameter.#
Markdown source
:::{interactive-plot3d}
backend: threejs
width: 100%
height: 440px
interactive-var: h, 0.5, 3, 26
interactive-var-start: 2
xrange: (-3, 4)
yrange: (-3, 3)
zrange: (-1, 4)
axis: off
hidden-edges: dashed
prism: center=(-1.5,0,0), radius=1, sides=5, height=h, color=teal, alpha=1
pyramid: base=[(0.5,-1,0),(2.5,-1,0),(2.5,1,0),(0.5,1,0)], apex=(1.5,0,h), color=blue, alpha=0.55
text: at=(-1.5,0,h), offset=(0,0,0.4), value="Prism", fontsize=16
text: at=(1.5,0,h), offset=(0,0,0.4), value="Pyramid", fontsize=16

Two solids controlled by the same height parameter.
:::
5. A helix on a cylinder#
Move r to change the radius of both the curve and the surface. The curve runs around the x axis, matching the convention for solids of revolution.
Static preview. Enable JavaScript for an interactive view.
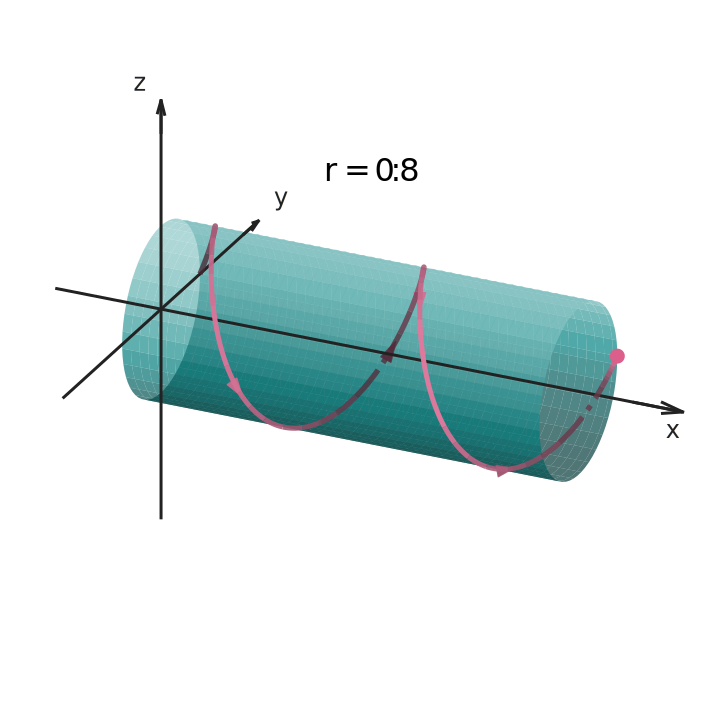
Fig. 4 A parametric helix and a surface of revolution share a live radius.#
Markdown source
:::{interactive-plot3d}
backend: threejs
width: 100%
height: 440px
interactive-var: r, 0.4, 1.4, 21
interactive-var-start: 0.8
xrange: (-1, 5)
yrange: (-2, 2)
zrange: (-2, 2)
ticks: off
elev: 25
azim: -65
solid-of-revolution: r, (0,4), teal, samples=24, radial-samples=40, alpha=0.2
curve: x=t/pi, y=r*cos(t), z=r*sin(t), t=(0,4*pi), samples=400, color=red, lw=2.5, arrows=true, arrow-count=4
point: (4,r,0), red
text: at=(2,0,1.7), value="$r={r:.1f}$", fontsize=16

A parametric helix and a surface of revolution share a live radius.
:::
6. Reusable constructions with macros and repeats#
Move a to change the heights of three pillars. A macro defines one pillar and its label; use places three copies, and repeat places the reference points.
Static preview. Enable JavaScript for an interactive view.
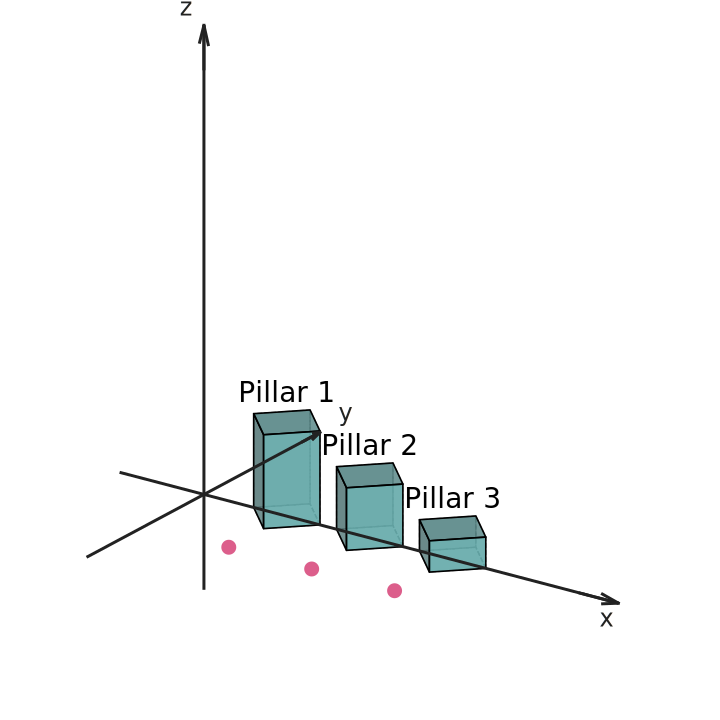
Fig. 5 Reusable geometry and repeated points update without pre-rendered frames.#
Markdown source
:::{interactive-plot3d}
backend: threejs
width: 100%
height: 440px
interactive-var: a, 0.5, 2, 16
interactive-var-start: 1
xrange: (-1, 5)
yrange: (-2, 2)
zrange: (-1, 5)
ticks: off
let: height = a**2
macro: pillar(pos, h)
prism: center=(pos,0,0), radius=0.4, sides=4, height=h, color=teal, alpha=0.8
text: at=(pos,0,h), offset=(0,0,0.3), value="Pillar pos", fontsize=14
endmacro
use: pillar(1, height)
use: pillar(2, 2*height/3)
use: pillar(3, height/3)
repeat: i=1..3; point: (i,-1,0), red

Reusable geometry and repeated points update without pre-rendered frames.
:::
7. A plane intersecting a sphere#
Move h to slide the plane through the sphere. With auto-intersections: true, the dashed circle where the two surfaces meet is detected and drawn automatically — no need to specify its center, radius, or plane.
Static preview. Enable JavaScript for an interactive view.
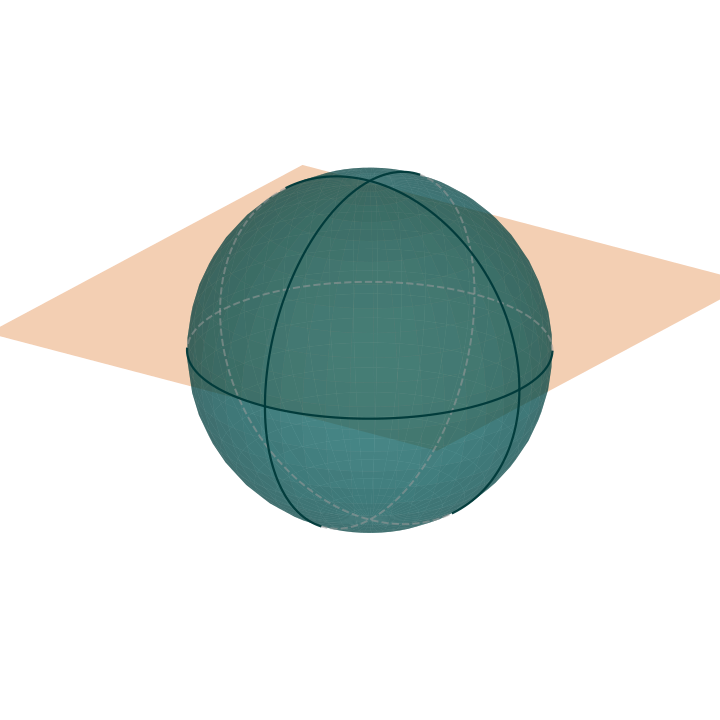
Fig. 6 The circle disappears once the plane slides past the sphere entirely.#
Markdown source
:::{interactive-plot3d}
backend: threejs
width: 100%
height: 440px
interactive-var: h, -1.5, 1.5, 31
interactive-var-start: 0.5
xrange: (-3, 3)
yrange: (-3, 3)
zrange: (-3, 3)
axis: off
auto-intersections: true
sphere: center=(0,0,0), radius=2, color=teal, alpha=0.5
plane: equation=z = h, color=orange, alpha=0.3

The circle disappears once the plane slides past the sphere entirely.
:::
Drag to rotate, scroll or pinch to zoom, or use the keyboard-accessible view
buttons. Geometry sliders preserve the camera. A slider used in elev, azim,
or zoom updates that setting. Reset uses the camera expressions at the current
slider values. Coordinates are right-handed with z pointing up. Camera angles
are in degrees; regular polygon rotation and trigonometric expressions use radians.
8. Aligning a figure inside a container#
width and align are read the same way as plot/plot3d-2: the wrapping
figure itself gets the requested width (as style="width: ..."), so an
align: right/align: left figure floats at that size — capped to 100% of
whatever parent it is placed in (an admonition, a grid cell, …) — instead of
filling the whole row.
A note with a right-aligned figure#
Static preview. Enable JavaScript for an interactive view.
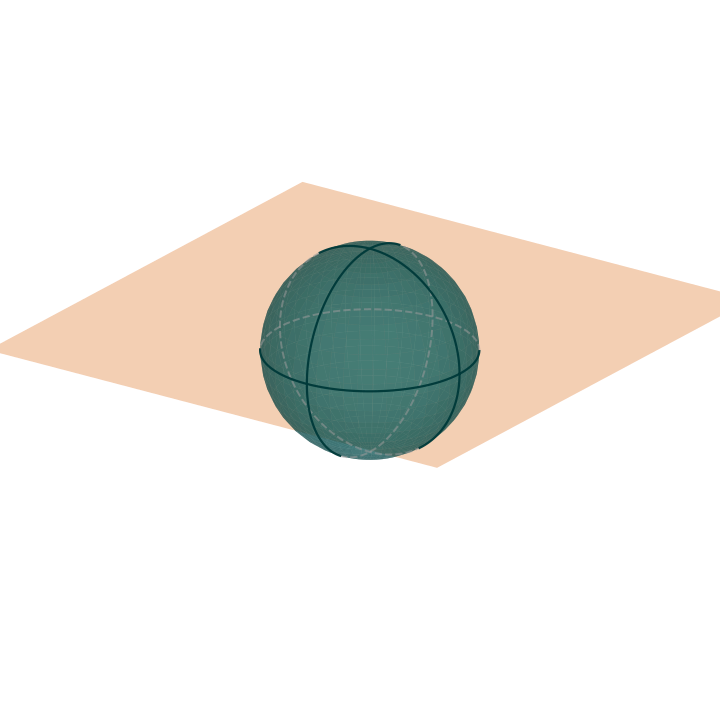
The figure stays inside the box to its right, sized to 45% of the box’s own
width — not 45% of the full page — and text wraps around it just like it does
for a plot3d-2 figure with the same width/align options.
::::{summary} A note with a right-aligned figure
:::{interactive-plot3d}
backend: threejs
width: 45%
align: right
height: 320px
axis: off
sphere: center=(0,0,0), radius=2, color=teal, alpha=0.5
plane: equation=z = 0.5, color=orange, alpha=0.3
circle: center=(0,0,0), radius=2, plane=z=0.5
:::

The figure stays inside the box to its right, sized to 45% of the box's own
width — not 45% of the full page — and text wraps around it just like it does
for a `plot3d-2` figure with the same `width`/`align` options.
::::
Primitive reference#
Every primitive is written as a kind: arguments line inside the directive’s
content block, one line per item (repeat: expands to many). Arguments are a
comma-separated mix of positional values and key=value pairs; a top-level
comma inside (...)/[...] does not split the argument. Point/vector
coordinates are always (x, y, z) (or an expression per coordinate), and any
numeric field may reference interactive-var sliders, let/def bindings,
and the constants pi/E.
Scene-level settings#
One key: value per line, before any primitive lines. Nothing listed here is
required; every key has a default.
Key |
Default |
Meaning |
|---|---|---|
|
|
CSS size of the figure/board. |
|
|
|
|
— |
Passed through to the generated figure/image node. |
|
— |
Trailing non- |
|
|
Show the x/y/z axis arrows and labels. |
|
|
Show a dotted xy-plane grid at |
|
|
Global tick toggle; |
|
|
Axis extent; also the default plane-equation clip box. |
|
|
Tick spacing; at most 200 intervals per axis. |
|
|
Axis label text (LaTeX); |
|
|
Initial camera (degrees, degrees, scale factor); may reference sliders. |
|
|
Default px font size for axis ticks/labels and any |
|
|
Default line width for every primitive unless it sets its own |
|
|
Scene-wide default for the hidden-line dash pass ( |
|
|
Auto-draw a gray dashed intersection circle for every top-level |
|
|
Show the Reset view/Rotate/Tilt/Zoom button row below the board. |
|
— |
Present (any value) forces the initial-state PNG fallback to regenerate. |
|
— |
|
|
middle step |
Initial slider value(s): a bare value for a single slider, or |
|
— |
Only meaningful for |
point#
point: at=(x, y, z), color=black
point: (2, 1, 1), black
Required:
at(or the first positional value).colormay be the second positional value.
vector#
vector: from=(0, 0, 0), to=(3, 3, 4), color=red
vector: (0, 0, 0), (2, 1, 1), red
Keys:
from/to(aliasesstart/end), or the first two positional values.colormay be the third positional value.Drawn as a line with an arrowhead at
to.
line-segment#
line-segment: from=(0, 0, 0), to=(2, 2, 0), color=black
Same arguments as
vector(including the positional-color shorthand), but drawn as a plain segment with no arrowhead.
line#
Infinite line, clipped to the viewing box. Two forms:
line: point=(0, 0, 0), direction=(1, -1, 1), style=dashed
line: from=(0, 0, 0), to=(1, 1, 1)
line: through=[(0, 0, 0), (1, 1, 1)]
point=/direction=draws the line throughpointalongdirection.Otherwise the line passes through
from/to(aliasesstart/end, or the first two positional values, or a singlethrough=[p0, p1]list).
plane#
plane: equation=z = 0, color=orange, alpha=0.25
plane: normal=(0, 0, 1), point=(3, 2, 1), span=(4, 4), color=blue, alpha=0.2
equation=is a linear equation string inx,y,z(reduced via SymPy); the plane is clipped toxrange/yrange/zrange(scene defaults unless given per-item).normal=/point=draws a fixed-size quad throughpoint, perpendicular tonormal;span=(sx, sy)sets its width/height (a single number applies to both), default(4, 4).
sphere#
sphere: center=(-1, -1, 1), radius=0.6, color=teal
Required:
center,radius.resolution=(aplot3d-2/fallback-only mesh option) is not supported here.
circle#
Plane–sphere intersection circle.
circle: center=(0, 0, 0), radius=2, plane=z=h, color=black
circle: center=(0, 0, 0), radius=2, normal=(0, 0, 1), point=(0, 0, 1), color=black
Required:
center,radius, and a plane given viaplane=/equation=(a linear equation string) ornormal=/point=.Defaults to
style: dashed. Raises an error if the plane doesn’t meet the sphere.Set
auto-intersections: trueat the scene level instead of writing these by hand: every top-levelplane/spherepair that actually intersects gets an automatic gray (#555555) dashed circle, withhidden-edges: off. Only top-level primitives are considered (not ones produced byrepeat).
angle#
angle: dir1=(1, 0, 0), dir2=(0, 1, 1), radius=0.7
angle: at=(0, 0, 0), to1=(1, 0, 0), to2=(0, 1, 0), color=teal
atdefaults to(0, 0, 0).dir1/dir2(aliasesdirection1/direction2,v1/v2) give directions fromat;to1/to2give absolute points instead.radius(aliasr) sets the arc radius, default0.35.Draws the arc in the plane spanned by the two directions.
right-angle#
right-angle: at=(0, 0, 0), dir1=(1, 0, 0), dir2=(0, 1, 0), size=0.4
atis required (no default). Samedir1/dir2/to1/to2aliases asangle.size(notradius) sets the marker’s edge length, default0.35.Only drawn while the two directions stay perpendicular; otherwise this item is skipped (see the note above about per-item errors).
normal-segment#
Two independent modes, auto-detected from the keys given:
normal-segment: point=(1, 1, h), plane=z=0, color=blue, right-angle-size=0.4
normal-segment: point=(1, 1, a), plane-normal=(0, 0, 1), plane-point=(0, 0, 0)
normal-segment: point1=(0, 0, 0), direction1=(1, 0, 0), point2=(0, 2, 3), direction2=(0, 1, 0)
Point-to-plane:
point=/p=plus a plane viaplane=/equation=orplane-normal=/normal=+plane-point=/plane_point=/on-plane=. Draws the perpendicular segment from the point to its foot on the plane.Line-to-line:
point1=/p1=+direction1=/dir1=/v1=andpoint2=/p2=+direction2=/dir2=/v2=. Draws the common perpendicular (shortest connecting) segment between the two lines.right-angles(defaulttrue): draw right-angle marker(s) at the foot/feet.points(aliasendpoint-points, defaulttrue): draw point markers at both ends.right-angle-size(aliassize, default0.35),right-angle-color(defaultblack),endpoint-color(aliaspoint-color, defaultblack).The auto-generated right-angle markers are always solid, regardless of the segment’s own
style/linestyle.
text#
text: at=(2, 1, 1), value="$A$", ha=left, va=top
text: at=(a, 1, 2), offset=(0.1, 0.1, 0.1), value="$P=({a:.1f},1,2)$", fontsize=15
Required:
at,value(aliaslabel).offset=(dx, dy, dz)nudges the label off the anchor point, default(0, 0, 0).ha:left/center/right;va:top/center/bottom; both default tocenter.fontsizedefaults to the scene’sfontsize.valuemay mix prose with$...$KaTeX math and{name}/{name:.Nf}interpolation of the current slider/binding value (e.g.{a:.1f}).
curve#
Parametric curve in a parameter t.
curve: x=t/pi, y=r*cos(t), z=r*sin(t), t=(0, 4*pi), samples=400, color=red, lw=2.5, arrows=true, arrow-count=4
Required:
x=,y=,z=expressions int(and any scene variables).t=(aliastrange=) parameter range, default(0, 1).samples: 2–2000, default300.arrows:true/false, defaulttrue;arrow-count(aliasarrows-count): 0–20, default3.A non-finite sample breaks the path instead of joining straight across the singularity.
ngon (filled polygon)#
ngon: points=[(0, 0, 0), (2, 0, 0), (0, 2, 0)], color=blue, edgecolor=black
ngon: [(0, 0, 0), (2, 0, 0), (0, 2, 0)], blue
points=(aliasvertices=, or the first positional value) needs at least three vertices.colormay be the second positional value;edgecolordefaults toblack.
prism#
prism: center=(-1.5, 0, 0), radius=1, sides=5, height=h, color=teal, alpha=1
prism: base=[(0, 0, 0), (2, 0, 0), (2, 2, 0), (0, 2, 0)], vector=(0, 0, a), edgecolor=black
Regular base:
center=,radius=,sides=(3–200), optionalrotation=(radians, default0).Explicit base:
base=[(...), ...], at least three vertices.Extrusion:
height=(straight up along z) orvector=(dx, dy, dz)(any direction) — mutually exclusive.edgecolordefaults toblack.
pyramid#
pyramid: base=[(0.5, -1, 0), (2.5, -1, 0), (2.5, 1, 0), (0.5, 1, 0)], apex=(1.5, 0, h), color=blue, alpha=0.55
pyramid: center=(0, 0, 0), radius=1, sides=4, apex=(0, 0, a), base-color=none, side-color=blue
Base given the same way as
prism(center/radius/sides/rotation, orbase=[...]).apex=is required.color=tints both faces;base-color=/side-color=(aliasbody-color=forside-color) set them independently; either acceptsnoneto omit that face entirely.edgecolordefaults toblack.
solid-of-revolution#
Surface swept by revolving |f(x)| around the x axis.
solid-of-revolution: r, (0, 4), teal, samples=24, radial-samples=40, alpha=0.2
solid-of-revolution: sqrt(x + a), (0, 2), blue, samples=40, radial-samples=32
Positional: expression in
x,(xmin, xmax)range, color.samples(axial rings): 2–160, default40.radial-samples(segments around the axis): 8–96, default32.
repeat#
repeat: i=1..3; point: (i, -1, 0), red
repeat: name=lo..hi; kind: arguments—lo/himust evaluate to integers at most 999 apart (inclusive, either direction);nameis usable inside the child primitive’s own expressions.Nests up to 8 levels deep; the fully expanded scene is capped at 1000 primitives.
macro / use#
macro: pillar(pos, h)
prism: center=(pos, 0, 0), radius=0.4, sides=4, height=h, color=teal, alpha=0.8
text: at=(pos, 0, h), offset=(0, 0, 0.3), value="Pillar pos", fontsize=14
endmacro
use: pillar(1, height)
use: pillar(2, 2*height/3)
macro: name(param, ...)… body lines (any primitives,let,def) …endmacro.use: name(arg, ...)textually expands the body, substituting parameters; eachusegets its own private copy of anylet/defnames declared inside the macro, so repeated uses don’t collide.
let / def#
let: height = a**2
def: f(u) = height + sin(u)
let: name = exprdeclares a scalar binding; laterlet/def/primitive expressions may reference it. Declare bindings before using them.def: name(params) = exprdeclares a reusable function callable like any built-in (e.g.f(pi/2)) from later expressions.Both stay live: they re-evaluate whenever a slider changes.
Arithmetic supports pi, E, sqrt, exp, log, the trigonometric and
hyperbolic functions, and Abs, with ** for powers, through a validated
expression tree (no JavaScript eval).
Rendering and migration limits#
Three.js 0.180.0 and KaTeX 0.16.22 are bundled with MIT licenses. ES modules
use relative imports and need a page served over HTTP(S); opening HTML directly
with file:// may show only the static fallback. Figures share one WebGL context
and render on demand. Unchanged geometry is retained when a slider moves;
removing figures releases their controls and graphics resources.
This is a functional live backend, with visual parity work still outstanding:
intersecting transparent surfaces can sort imperfectly (use an explicit circle:
to mark a plane-sphere intersection unambiguously); legacy depth shading and
camera-facing opposite-angle semicircles are not yet matched. Labels stay
within the board, but crowded labels may overlap. Points
are drawn as screen-sized markers and are not draggable. Object references and
constraints between named points are not yet supported. Mobile gestures have
Chromium emulation coverage; physical-device verification remains to be done.
The fallback uses plot3d-2 styling and always shows initial slider values,
including when printing after interaction. Per-axis tick overrides and optional
hidden-edge styling can differ from the live scene. usetex is disabled for the
fallback. Undefined objects are omitted with a status message; right-angle
markers disappear if their directions cease to be perpendicular.
Axis ranges, tick spacing, and global font size must be constant. Each axis is
limited to 200 tick intervals. Curves have at most 2000 samples; regular bases
have 3–200 sides; repeats have integer inclusive bounds and the expanded scene
is limited to 1000 primitives. Surface sampling is limited to 160 by 96.
Arithmetic supports pi, E, sqrt, exp, log, trigonometric/hyperbolic
functions, and Abs, with ** for powers. A validated arithmetic tree is used
instead of JavaScript eval; the broader legacy SymPy language is not supported.
Frame-only options (interactive-workers, interactive-max-frames, parallel)
warn and are ignored. nocache refreshes the initial fallback. figsize controls
the fallback; use positive CSS height/width dimensions for the live board.
height: auto is not supported. Use backend: frames when an existing figure
needs a legacy feature not yet supported here.
Remaining implementation plan#
Validate representative textbook figures and physical touch devices; refine label placement, transparent surfaces, and sphere/angle styling.
Audit remaining
plot3d-2options and shared static/live scene semantics.Switch the default from
framesonce that compatibility audit passes, with migration notes and explicitbackend: framesretained for older figures.Add draggable points and dependent constructions as a separate extension.
Development checks#
PYTHONPATH=src python -m pytest tests/test_scene3d.py tests/test_plot3d2_directive.py
node --test tests/test_scene3d_runtime.cjs
tests/scene3d_browser.cjs /path/to/demo/html starts a local server and checks
bundled assets, sliders, camera preservation, mouse/touch rotation, math labels,
responsive sizing, multiple figures, context recovery, disposal, printing, and
no-JavaScript/no-WebGL fallbacks. Generate its fixture using build_demo in
tests/test_scene3d.py; Playwright is required, and MUNCH_CHROMIUM can select
an existing Chromium executable.